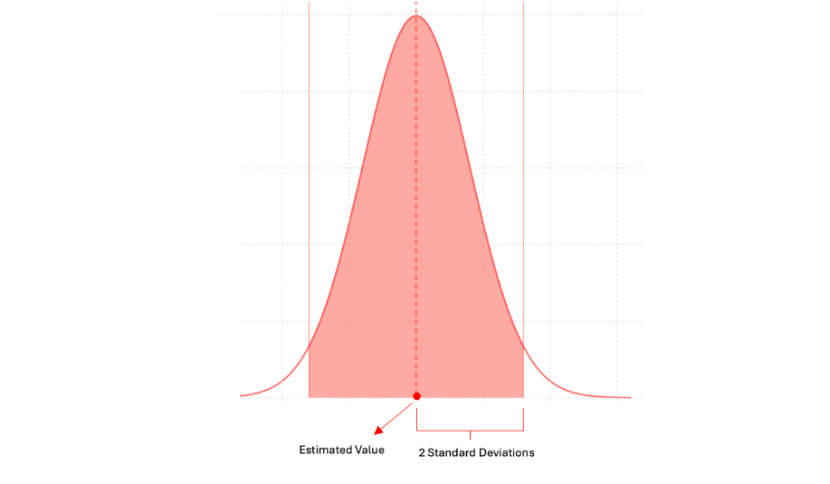
A standard deviation (or σ) is a measure of how dispersed the data is in relation to the mean. In the context of blueberry prices for instance, it helps us understand the consistency and reliability of the prices. Here's how:
Low Standard Deviation (Small σ):
Indicates that the blueberry prices are clustered tightly around the mean price. This suggests that the pricing is consistent and reliable, demonstrating high accuracy in reflecting market conditions.
Example: If the prices of blueberries throughout the week are $2.00, $2.03, $2.02, $2.01, and $2.02, the standard deviation is low. This shows that the prices are stable and don't deviate much from the average price, indicating accurate and consistent pricing.
High Standard Deviation (Large σ):
Indicates that the blueberry prices are more spread out from the mean price. This suggests that the pricing is less consistent and reliable, demonstrating lower accuracy in reflecting market conditions.
Example: If the prices of blueberries throughout the week are $1.50, $2.50, $3.00, $1.00, and $2.00, the standard deviation is high. This indicates that the prices are fluctuating widely, making the pricing less accurate and consistent.
Standard Deviation Close to Zero:
Indicates that the blueberry prices are very close to the mean price. This implies extremely high accuracy as the prices show very little variation.
Example: If the prices of blueberries throughout the week are all exactly $2.00, the standard deviation is almost zero. This means the prices are highly accurate and show no deviation from the mean price, reflecting a very stable market.