The Netherlands is the second largest blueberry exporter in the world. That might sound strange, but as the home to Rotterdam, the largest port in Europe and with a limited population, the destination receives a lot of fruit, which it then re-exports throughout Europe and the world, although their biggest customer is Germany. The link to the country overview can be accessed through the following link:
https://agronometrics.com/p/gtd_errors/country/NDL?prod=un&flow=exports
Netherlands Volume - The data from the Netherlands works in a very different manner to what we have observed from origins like Peru. First of all the data is made available with a considerable delay, usually 2 or 3 months. Another peculiarity is that the latest month made available is severely under reported, offering limited value. When we started analyzing the data it quickly became evident that those underreported values were in fact a very consistent percentage of the final volumes that would eventually be reported by the country. We don't exactly know why this might be the case, a working theory is that one export office in the Netherlands reports their exports before other offices and their internal systems make it available for us to use. Either way, that little dot that precedes the rest of the volume, is a fantastic indicator of what the total exported value will eventually be once everything is accounted for. So that is exactly what our service presents as the estimated value.
It is interesting that the error rates contract three months after the latest point available and then expand again. This seemingly implies that there are adjustments made to the data 4-8 months back, but that third month still serves as the best indicator for what volumes will ultimately be.
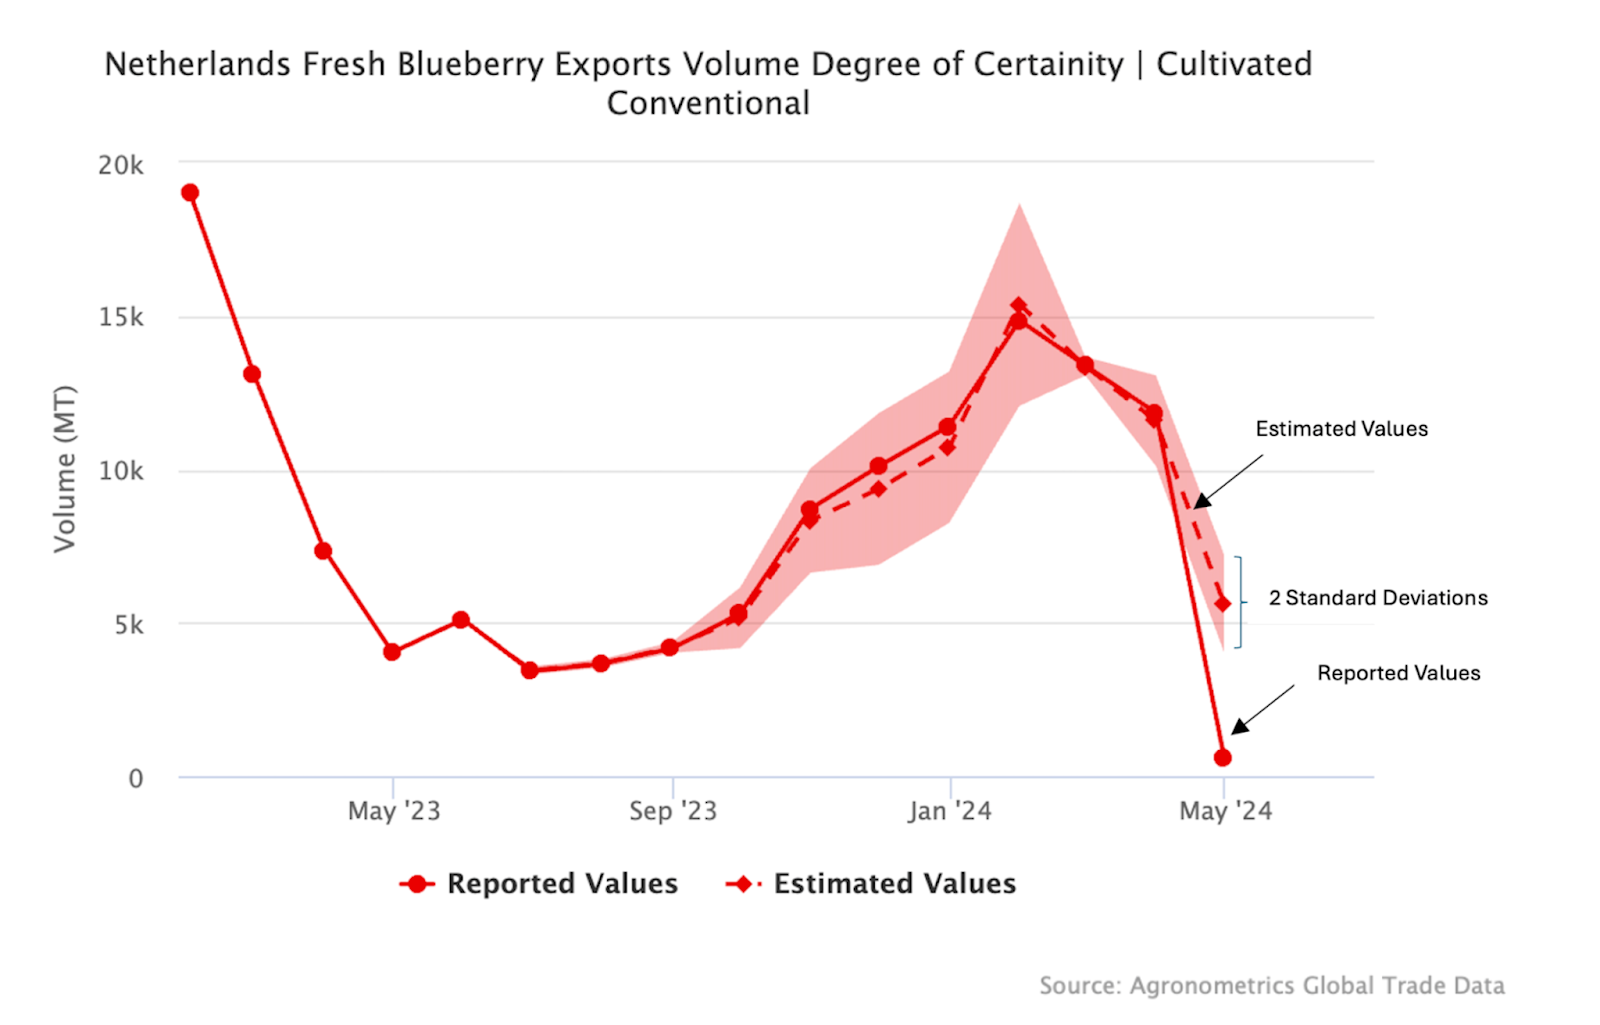
Agronometrics users can view this chart with live updates here
Netherlands Prices - The prices work in a very similar fashion, but in this case their tendency to report values that are too high. As a consequence our systems automatically identify this variance and offer an estimated value that is more realistic, at least based on the historical trends we have seen in past reports.
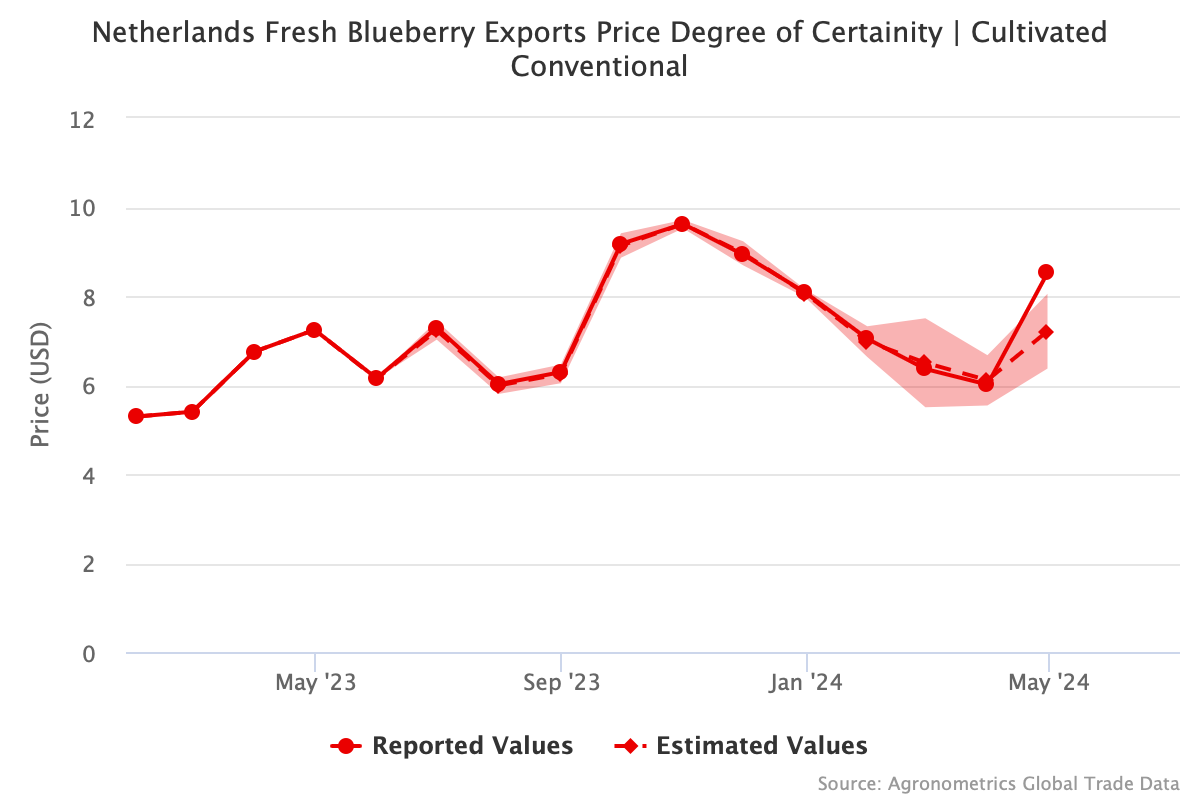
Agronometrics users can view this chart with live updates here
Netherlands Value - As with volumes, we see that value is heavily under reported in the latest month published and the initial data reported is a very useful indicator of the volumes that will eventually be published that month.
