Peru offers some of the best export data available in the world. Our tools in particular offer unparalleled access to up to date exports, with weekly data updated every monday. Like all data, however, it isn't perfect. That said, the error measurement tool is particularly useful for understanding the information made available from this source. The link to the country overview can be accessed through the following link:
https://agronometrics.com/p/gtd_errors/country/PER?prod=un&flow=exports
Peru Volumes - The first thing you may notice is that volumes appear to not show any error. That is not a mistake, what is reported is very often very close to the final numbers made available by the country. The reason for this is most likely because the export service reports the volume loaded on ships and planes very accurately. Also, once the fruit is loaded, there isn't much that changes, so the numbers stay stable.
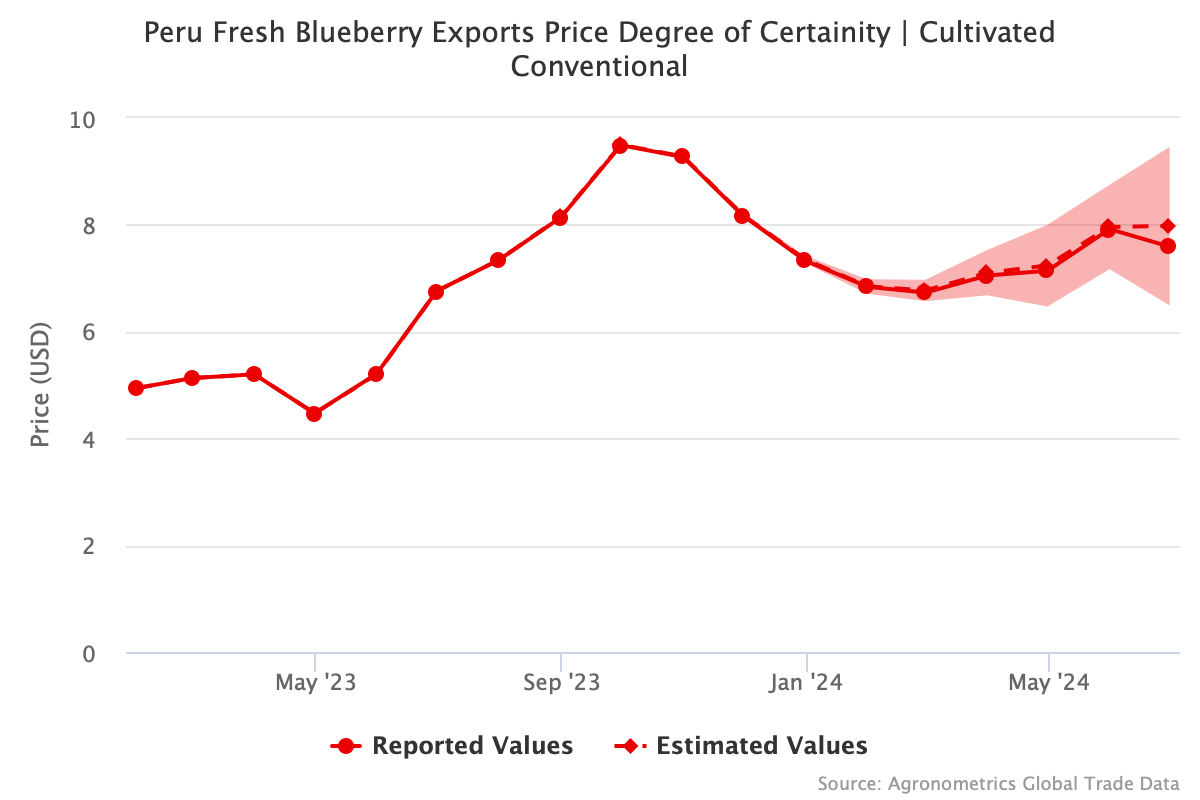
Peru Prices - Prices require a bit more of a nuanced look, but this is where the error measurements tool really shines. From our statistical analysis we could see that error rates gradually reduced over time, but what really struck us was the consistency of the rate by which prices were being under reported. After consulting with our industry partners, the consensus is that this is most likely the case because the value of the exports are initially under-declared in order to not pay excess taxes. As the money from the sale makes it back to Peru, the value is adjusted to reflect the actual value of the transaction and pay the due taxes. The interesting thing from a data analysis standpoint is that exporters seem to be very consistent in the discount rate they apply to the exports when first reported, this allows us to use the under reported values declared at export to estimate what the future price will be once all transactions are settled (Estimated Value).
Agronometrics users can view this chart with live updates here
Peru Value - Through the Global Trade Data Service, prices are a function of value in that they are calculated by taking the total value and dividing it by the volume, offering a weighted price per kilo which are the prices reported throughout the GTD platform. Through this calculation, the exact same logic that was mentioned in prices applies to Value.
Use Case Exporter - As our Degree of Certainty tool is able to demonstrate the stability in the dataset, the use cases for the data from Peru are vast, however, the most prominent one that many of our clients rely on will be estimating the arrivals for Peruvian fruit in other markets. If you are an exporter that shares some of your production window with Peru, this information can help you price your fruit to account for the exports that Peru has already put on the water. In the case volumes are short, you can use the GTD data to negotiate higher pricing that is reflective of the real market situation and the fact that importers will be short of fruit if they don't pay higher prices. Conversely, in the case of high expected volumes, it might be wise to lower the price you are willing to accept to make sure your product finds a home.
The estimated pricing data gives a decent indicator of the pricing Peruvian producers are currently accepting for fruit, which can add perspective to your own negotiations.
Use Case Importer/Retailer - If you are an importer you will likewise want to price the fruit to ensure that volumes can move through the supply chain, if supplies are expected to be short, that gives room to pay a higher fee to secure volume. If supply is expected to be high, it is also important to price fruit accordingly so you don't get stuck trying to sell something that you paid too much for while even more fruit is on the water potentially pushing prices down further still.
The pricing indicator offers a perspective of what Peruvian exporters are realistically paying for fruit and may be a good starting point with which to negotiate prices.
